Application monitoring is a process to track and measure the performance and heartbeat of a software application in real-time or close to it.
Application monitoring involves the use of simple tools already provided by the operating system or specialized software solutions and tools that collect data about various metrics. This collected data is then analyzed either in real-time or identify performance and access issues, or later using analysis tools for comprehensive debugging or decision-making purposes.
See Also
In this post, I will take a closer look at application monitoring purposes, best practices and further discuss key metrics to monitor.
What is Application Monitoring
Application monitoring refers to the practice of monitoring the performance, availability, and behavior of software applications.
Application monitoring typically involves tracking various performance metrics such as response time, throughput, error rates, and resource utilization. Using this information one can identify bottlenecks and issues impacting the availability and performance of an application.
Further monitoring metrics can be used to improve user experience, response times, and capturing user interaction and behavior.
Why Monitor Applications?
Monitoring applications are not limited to technical aspects only. Metrics and strategies are also built around user behavior. Let’s look at some aspects of application monitoring.
Ensure Applications Provide a Certain Level of Performance (SLA)
A Service Level Agreement (SLA) is a contract between a service provider and their customers that outlines the level of service they can expect to receive. Using metrics gathered from monitoring applications you can ensure that the application is respoinding with the agreed upon SLA.
With monitoring key performance metrics (KPMs), such as response time, throughput, and error rates, admins can quickly identify issues and address them proactively.
There may be penalties associated with an SLA. Monitoring can help avoid penalties associated with breaches in contracts.
Improve Application Performance
Using metrics collected from monitoring helps to identify bottlenecks and other issues. This information can then be used to improve the architecture and code of the application, or the system to optimize resource usage and response times.
Reduce Downtime
A monitoring metric, such as a heartbeat from a running application can help minimize downtime when detected in real time.
Using other metrics such as response times, throughput, and error rates, can identify in advance issues that may become a problem if not resolved in a timely manner.
Improve User Experience
During user interaction, information can be collected that can be used to how a user may use the system. This information can be used to improve the User Experience (UX), of the application. Some examples of UX improvements are:
- Reduce the number of clicks it takes for a user to access their activity screen.
- The layout of the on-screen elements.
- Response times of the user interface.
A positive user experience leads to higher user satisfaction, better customer loyalty, and increased customer retention.
Types of Application Monitoring
As I have described in an earlier section, application monitoring is a multi-faceted approach that involves tracking and analyzing the performance, availability, and behavior of applications in real-time.
To address these needs there are different types of monitoring approaches that are used to ensure that the applications are performing optimally and delivering an acceptable user experience.
Let’s look at the different types of application monitoring.
Log Monitoring
Most applications are configured to log their activity and errors, to a log file or some other reporting mechanism. Using active and passive log analysis, we can identify issues.
Real time monitoring of logs provides insights into how an application is behaving. For example, errors such as the HTTP a4xx errors for a web server provide information about applications not able to access data. Using such information, support personnel, can quickly look into resolving this specific problem. This is an example of active log monitoring.
Passive log monitoring tools, can analyze the information in the logs to identify patterns that may provide additional information such as usage trends or network penetration attempts.
Infrastructure Monitoring
Monitoring Infrastructure looks at metrics of the underlying IT infrastructure supporting the application. Infrastructure components include servers, firewall, storage, and network.
Actively monitoring infastructure components ensure that all services and components that an application depends on are working and ablt to support the said applications.
Infrastructure monitoring includes key metrics, such as CPU usage, network traffic, and disk storage.
Real User Monitoring (RUM)
RUM tracks user interactions with the application in real-time. By monitoring user behavior metrics, application developers and designers can identify opportunities for impovements for user experience (UX).
Some common RUM metrics are page load time, response times for first byte, error rates, conversion and bounce rates for web applications.
Synthetic Monitoring
Monitoring the performance of specific code segments within an application to identify performance bottlenecks falls under the umbrella of synthetic monitoring. This is called code-level analysis and is done using application code profiling tools.
Using synthetic monitoring techniques, a tester or developer can test the functionality and performance of application code under different conditions. These conditions are simulated for various scenarios such as when an application is under excessive load to identify code that is the bottleneck in the workflow.
Application Performance Management (APM)
APM is a comprehensive approach to application monitoring that combines one or more of the techniques discussed above.
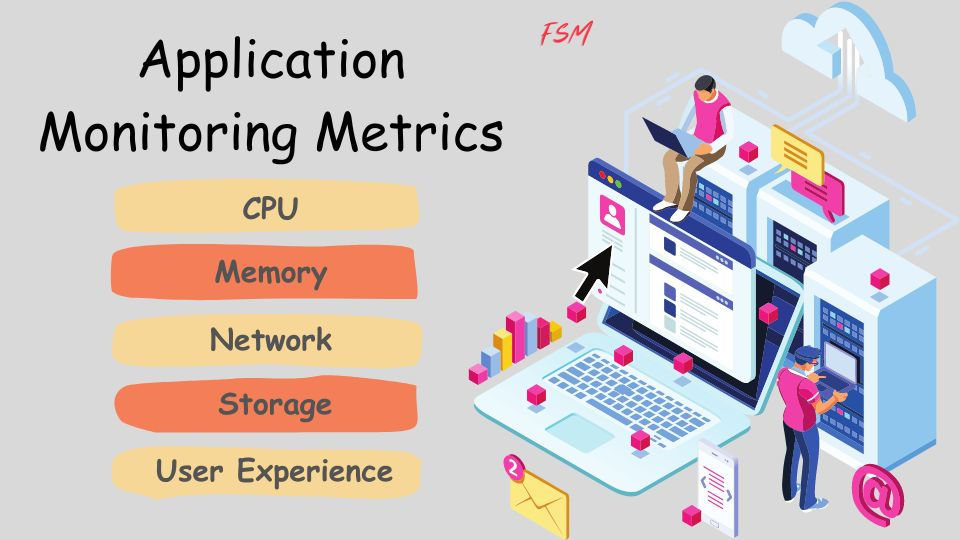
Application Monitoring Metrics
Application metrics to monitor will depend on the specific application being watched. A desktop (thick client) will have different metrics when compared against metrics for a web application.
There is a common set of metrics that is constant across most applications. Let’s review important metrics that monitoring software should capture for most applications.
| Category/Metric | Description |
|---|---|
| CPU Usage | For applications, this is the slice of CPU that is being used only by the application. This can be used as a percentage (%) to find how much of the total system resource an application is using. |
| Disk Space Usage | The total amount of disk space being used by the application. |
| Memory Usage | Total memory being used by the application. Similar to CPU usage, the percentage (%) is also calculated to find out usage compared to the total system memory. |
| Network Latency | How much time it takes for a round-trip communication between the application server and down/upstream data consumers and providers. |
| Database | Under the database category, metrics such as query response time, transaction throughput, and database usage are monitored. |
| User Activity | The number of users, requests/second, and session times metrics are part of this category. Monitoring user activity can help identify usage and load patterns for the application. |
| Response Time | Response time is the time it takes for an application to respond to a user request. |
| Error Rates | The number of errors being generated directly by the server or through user activity. |
| Throughput | Throughput provides the number of requests processed by an application over a certain period of time. |
| Resource Utilization | Resource utilization category includes the following: Amount of CPU, memory, and disk resources that are being consumed by the application. |
| User Experience | This category of metric, includes page load times, bounce rates, and conversion rates for an application. |
Implementing Application Monitoring Software Tools
With the complexity of the modern network and application infrastructure, manually monitoring application metrics is a task that is almost impossible. Using modern tools to implement automated monitoring solutions is the best approach for keeping an eye on applications and systems.
In this section let’s look at how an organization can approach rolling out a new monitoring tool.
1. Defining Monitoring Goals and Objectives
The first step is to define the scope of your monitoring requirements. You should identify
- Applications
- Systems
- Networks
- Type of alerts
- Notification channels
Identifying key metrics to monitor should also be part of the requirements.
2. Selecting the Right Tools
Once you have clear requirements and direction of what you are trying to monitor and what to do with the data you will collect, the next step is to identify several monitoring tools for further analysis.
The analysis step will include mapping your requirements to the feature sets provided by each of these monitoring solutions. From this analysis, you will shortlist a few candidates for further consideration.
Listed below are some factors that should be part of your selection criteria:
- Alerting
- Cost
- Customization
- Ease of Use
- Functionality
- Integration
- Reporting
- Scalability
- Security
- Support
Once the shortlist has been compiled, then depending on time and resources you should select 1-3 tools for a Minimally Viable Product (MVP) testing that will involve actual users.
3. Establishing a Monitoring Strategy and Plan
Ok, now we have selected a monitoring tool that (mostly) matches our requirements. The next step is to form a monitoring strategy and a plan.
This planning should determine:
- Objectives: What you are going to measure.
- Metrics: Actual list of metrics to be collected.
- Scope of Monitoring
- Data collection: How and where the data will be collected.
- Alerts and notifications.
- Governance plan
- Change management process
The monitoring plan should be flexible and regularly reviewed for changes based on actual findings and business and application requirements.
A lot of information for this step should be coming from Step #1 above: Define monitoring goals and objective.
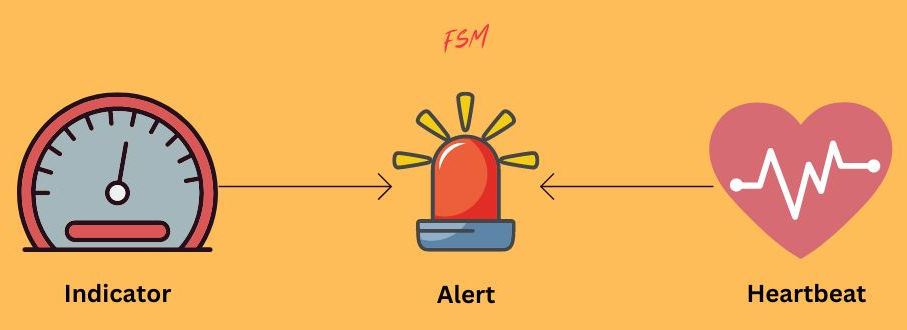
Setting Up Alerts and Notifications
With the plan certainly out of the way, the next step is to set up the actual alerts and notifications as defined in Step #3.
Set up and test the alerts and notifications you have identified earlier. During testing ensure that actual alerts are being raised for the right conditions. You don’t want to have a misconfigured alert in production that sends the monitoring person looking for a condition that does not exist.
You want to repeat the same testing procedure you performed with Alerts, executed on testing the notifications as well. Why send a server-down notification to the CMO?
Analyzing Monitoring Data
Once the monitoring tools and plan are in place, the next step is to analyze monitoring data. This involves reviewing performance metrics, looking at trends and patterns, and identifying areas for improvement.
Data analysis activity should be ongoing and the results regularly reviewed with the stakeholders.
Application Monitoring Tools
I have talked about how to select monitoring tools. Let’s look at actual monitoring solutions available for application monitoring.
Datadog is a cloud-based solution providing real-time visibility into your applications and infrsturcture. Datadog enables you to monitor your entire stack from servers to databases and other network services.
With Datadog, you can collect and analyze metrics, logs, and traces to gain insight into the health and performance of your systems.
AppDynamics is an application performance management and monitoring tool. This is also an end-to-end monitoring solution.
Using machine learning and AI-powered analytics engine it can attempt to detect anomalies and provide predictive insights into potential problems.
New Relic’s cloud monitoring solution provides the ability to monitor your complete software stack within a single unified platform.
It offers capabilities for infrastructure monitoring, browser application monitoring, mobile app monitoring, and other custom monitoring solutions, you can build using its excellent APis.
I find their real-time reports very accurate and easy to read.
Nagios is an open-source monitoring tool providng real-time monitoring for all of your IT infrastructure. It provides a flexible monitoring solution using a plugin-based architecture.
Nagios offers customizable dashboards, notifications, and reporting to provide visibility into the health and performance of your systems. Reports in Nagios provide historical data and trend analysis to compare data against historical baseline and trends.
Dynatrace is a also a full-stack application monitoring tool. It is an AI-powered platform with advanced machine learning capabilities. It can automatically detect anomalies and identify the root cause of issues.
The platform provides a range of capabilities including, APM, infrastructure monitoring, cloud monitoring, and digital experience monitoring. Similar to New Relic it also supports integration with Java, .NET, PHP, and Node.js.
There are many other excellent options available. Look for my upcoming post discussing in detail a list of the Top 10 Application Monitoring tools which will get into the feature and pros and cons of each solution.
Best Practices for Application Monitoring
To benefit most from a monitoring solution, there are certain best practices one should follow. I have done a complete post on this which provides an in depth guideline. Check out the link below.
For now, let’s take a quick look at some best practices.
- Define clear goals and objectives to ensure that application monitoring is effective.
- Establish a collaborative culture.
- Use the right tools and techniques to benefit from the features offered by your selected monitoring solution.
- Regularly review and update your monitoring processes.
- Provide ongoing training and support for your personnel.
Conclusion
Application monitoring is a proactive approach to ensure that software applications are performing optimally and delivering a good user experience.
By tracking and analyzing key performance metrics in real time, we can detect issues and hopefully get them resolved before they start impacting our users.
Therefore using the information gathered from application monitoring an organization can minimize downtime and provide a positive experience for their customers.
