Apache Web Server power over 30 percent of all websites. I believe the share is likely higher when you consider servers hidden behind corporation firewalls. This is a long way from its initial release in 1995. Based on its widespread use the Apache server logs provide invaluable information in understanding not only the incoming traffic but also the behavior of the visitors.
See Also
Overview: Apache HTTPD Server Logs
Apache logs are formatted text files that contain information about what the activities performed by Apache server. This could be information related to the website visitor, such as, time of access, IP they are coming from, URL being requested, and number of bytes being transferred over the network.
There are two main types of Apache logs, Access and Error. These can be set at server level or at Virtual Host level if you are serving multiple domains.
Log entries are done either in Common Log Format or in Combined Log Format. You have the option of customizing these log formats and create your own custom log format if you so desire.
All the logs are generally stored in log files on the file system with the option to route that info to SYSLOG.
Apache web server is a module-based web server. Using modules, you can enhance functionality, and this applies to logging as well. The following log modules are available:
- MOD_LOG_CONFIG
- MOD_LOGIO
- MOD_LOG_DEBUG
- MOD_LOG_FORENSIC
In this post I will provide insight into Apache logs. We will look into configuration and customization of Apache server logs as well as how to interpret and analyze the logged information.
Let’s start…
Apache Log Files and Logging Formats
As noted earlier Apache logs files record everything an Apache server is doing depending on how they are configured. All of this information is logged categorized by Access activity or encountered errors in separate files. These files can later be used for further analysis, both manual and automated. The two main log files are error and access.
Location of Apache Log Files
Depending on the operating system you are using, the default location for log files may be different.
One Windows the logs files are in the log folder, of the location where you installed the server. In my case files are located in the following names.
C:\apps\apache\httpd\logs\ # Default Apache Web Server logs location.On Ubuntu the config files are in the following.
/var/log/apache2/ # Default logs folderApache Error Log
The Apache server error log collects diagnostic diagnostic information about errors encountered by the server while processing incoming requests. The name and location of the ErrorLog directive.
ErrorLog "/var/log/apache2/error.log"Apache error log entries an be routed to syslog if needed. You can do this by specifying syslog instead of a file path as the argument to ErrorLog. You may want to do this if you have automated system monitoring tools looking at the syslog.
ErrorLog syslogError log entries are formatted using the ErrorLogFormat directive. An simple log format may be set using the example below.
ErrorLogFormat "[%{u}t] [%-m:%l] [pid %P:tid %T] %7F: %E: [client\ %a] %M% ,\ referer\ %{Referer}i"If you are hosting virtual domains with Apache web server you can use separate log files for each domain.
Understanding Apache Error Log Entries
The error log contains information about errors the web server encountered when processing requests, such as missing files. It also includes diagnostic information about the server itself. Here’s an example error log:
Like the Apache access logs, the format of the error messages can be controlled through the ErrorLogFormat directive, which should be placed in the main config file or virtual host entry. It looks like this:
ErrorLogFormat "[%{u}t] [%l] [pid %P:tid %T] [client\ %a] %M"The above configuration produces the following error log entry:
[Mon Nov 07 11:04:37.354888 2022] [error] [pid 36656:tid 1244] [client 127.0.0.1:57630] script 'D:/wp/index.html' not found or unable to statChanging the ErrorLogFormat to:
ErrorLogFormat "[%{u}t] [%-m:%l] [pid %P:tid %T] %7F: %E: [client\ %a] %M% ,\ referer\ %{Referer}i"will product the following log entry:
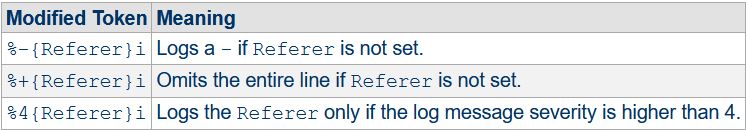
[Mon Nov 07 11:08:20.874259 2022] [php:error] [pid 19460:tid 1292] [client 127.0.0.1:57659] script 'D:/wp/site/index.html' not found or unable to statIn the second example above I added the -m option, which lists which module the error is coming from. I also added the Referer option which logs the Referer request header info. In my case since I am directly accessing the URL, the referer information is omitted. Modification options are used to manipulate data in log entries.
For formatting strings with ErrorLogFormat refer to the table below.
| Format Option | Description |
| %% | Percent sign. |
| %a | Client IP address and port. |
| %{c}a | Underlying peer IP address and port of the connection (used with MOD_REMOTEIP) |
| %A | Local IP address and port |
| %{name}i | Request header name |
| %k | Number of keep-alive requests on this connection. |
| %l | Loglevel of the message |
| %m | Name of module logging the message |
| %M | Actual log message |
| %t | Current time |
| %{u}t | Current time including micro-seconds |
| %v | Canonical ServerName of the current server. |
| % | (Percent sign with space) Field delimiter no output |
| \ | (Blackslash and space) Non-field delimiting space |
LogLevel
The LogLevel directive adjusts the level of detail that will be provided in the error log file. The following levels are available, in order of decreasing significance.
| Level | Description | Example |
|---|---|---|
emerg | System is unusable. | File system writes failed or system resources exhausted. |
alert | Action must be taken immediately. | Couldn’t determine user name from uid |
crit | critical situations that can affect the operation of the server resulting in not being able to serve clients. | Failed to get a socket. |
error | Error conditions. | Cannot serve directory /var/www/qlp/site/wp-includes/: No matching DirectoryIndex |
warn | Warning conditions. | server certificate does NOT include an ID which matches the server name |
notice | Normal but significant condition. | SIGBUS error, attempting to dump core in |
info | Informational. | “Server seems busy, (you may need to increase StartServers, or Min/MaxSpareServers)…” |
debug | Debug-level messages | Opening config file |
trace1-6 | Trace messages | |
trace7-8 | Trace messages, dumping large amounts of data |
Note: If you select a level, such as crit, then all error messages of higher significance, such as alert and emerg will be logged while those of lower significance such as warn will be ignored
Usually, the name of the module which raised the error will also be part of the string in the format [module:error_level]. Show below is an example from an actual log file.
[Mon Nov 07 00:00:04.310348 2022] [ssl:warn] [pid 78885:tid 140545043937152] AH01909: wp.local:443:0 server certificate does NOT include an ID which matches the server nameNote: If the LogLevel directive is not set, the server will set the log level to warn by default.
Apache Access Log with CustomLog Directive
Apache access logs provide information on all incoming requests received by the Apache web server. In the Access log you will find detailed information about the requests, such as the IP of the client, time of access, URL of the requested resource, response code as well as the time it took to process the request. There is additional information about the HTTP client such as browser name and version.
Access logs are plain text files and can be viewed using any text editor.
The location and content of the access log are controlled by the CustomLog directive. The LogFormat directive is used to describe the data to be captured and written to the log file. Below is how the aforementioned directives are used in the default config file.
LogFormat "%h %l %u %t \"%r\" %>s %b" commonUsing the log format descriptions above you can use the following in your config to set location and format of your logs as shown below:
CustomLog ${APACHE_LOG_DIR}/website-access.log common # This is using the common log format.Understanding Apache Access Log Entries
As I have mentioned earlier, an Access log file is a text file. You can view its content in any text editor. If you are have not looked at the log files before you may feel a bit overwhelmed the first time you look at the log entries.
Depending on how the logs are configured you may see each entry in a single line or wrapped text across multiple lines.
Common Log Format
The Common Log Format is the standardized access log format format used by many web servers because it is easy to read and understand. For Apache Web Server it is defined in /etc/apache2/apache2.conf file when using Ubuntu.
Let’s look at an example to understand the data in this file.
Using the default common LogFormat entry as shown below:
LogFormat "%h %l %u %t \"%r\" %>s %O" commonYou will see the following entries in the access log files.
127.0.0.1 - - [07/Nov/2022:22:54:34 +0000] "GET /wp-content/uploads/2017/04/bm-ad-1.jpg HTTP/1.0" 200 34791Combined Log Format
The Combined Log Format is very similar to the Common log format but contains a few extra pieces of information.
Server level LogFormat string for LogFormat is also defined in the /etc/apache2/apache2.conf file. The default value on Ubuntu looks similar to the one below.
LogFormat "%h %l %u %t \"%r\" %>s %O \"%{Referer}i\" \"%{User-Agent}i\"" combinedBelow is an example of log file entry when the combined format is used.
127.0.0.1 fsm FSM [07/Nov/2022:23:08:54 +0000] "GET / HTTP/1.0" 200 14312 "https://essentialsurvival.com/" "Mozilla/5.0 (Windows NT 6.1) AppleWebKit/537.36 (KHTML, like Gecko) Chrome/90.0.4430.93 Safari/537.36"In the above log entry, you can see that there are two additional pieces of information. The first is the name of the user (value of HTTP authentication header or REMOTE_USER environment variable) and the second is the information about the HTTP client.
Configuration options for the Access log are the same as those for Error Log. Check for options in the LogFormat options table above.
Assigning Nicknames
As shown above, in various examples of LogFormat, the last word in the line is the nickname for that specific LogFormat. You will use this nickname in your configuration files as a shortcut to set LogFormat strings. Saves a lot of typing and busy looking config files.
Virtual Host Logging Considerations
Multiple Apache virtual hosts can be configured either in a single file or using separate files for each virtual hosted domain. The best practice is to use separate files. In fact, that is the default method set on almost all Linux based distributions.
Logging for each virtual host should be done in separate files. This helps data isolation and makes it easy and fast to analyze the activity either manually or using any of the analysis tools. If for some reason you choose to use a single log file for all virtual hosts then Apache provides the nickname of vhost_combined which adds the domain name being served in the log entry.
LogFormat for single log files is defined in apache2.conf on Ubuntu. On Windows, there is no defined value. But if you want to add it is as shown below.
LogFormat "%v:%p %h %l %u %t \"%r\" %>s %O \"%{Referer}i\" \"%{User-Agent}i\"" vhost_combinedThis will add the domain name of the virtual host to the formatted log string.
Apache Logging Using JSON Format
Apache provides no options to save log entries in JSON. Though it is very easy to do so as the LogFormat is flexible enough to save log entries as JSON. Storing your logs as plain text makes them easier to scan in case you ever need to read your log files.
Here’s an example of a LogFormat to store logs in JSON format:
LogFormat "{ \"time\":\"%t\", \"request\":\"%U\", \"method\":\"%m\", \"status\":\"%>s\" }" jsonThis produces log entries with the following formatting:
{
   "time":"[07/Nov/2022:16:05:02 -0800]",
   "request":"/index.php",
   "method":"GET",
   "status":"200"
}
Apache Virtual Host Logging Example
The virtual hosting capability allows an Apache Web Server to host multiple domains on a single server. You can host both HTTP and HTTPS sites using the virtual host feature.
With the ability to serve multiple domains you also gain the option to log each domain to its own files for both Access and Error logs.
Here is what a Virtual Host file for a secure domain bm.com will look like.
<VirtualHost _default_:543>
		ServerAdmin webmaster@localhost
		ServerName  bm.com
		ServerAlias  bm.com

		DocumentRoot /var/www/bm
		<Directory /var/www/bm>
				Options FollowSymLinks MultiViews
				AllowOverride All
				Order allow,deny
				allow from all
		</Directory>

		ErrorLog ${APACHE_LOG_DIR}/bm.log
		CustomLog ${APACHE_LOG_DIR}/bm-access.log combined

		SSLEngine on

		SSLCertificateFile      /etc/ssl/certs/ssl-cert-snakeoil.pem
		SSLCertificateKeyFile /etc/ssl/private/ssl-cert-snakeoil.key

</VirtualHost>
I am not going to go over each option but for logging, you should be able to see that the ErrorLog entries are logged to bm.log and CustomLog (access log) entries are stored in bm-access.log using the combined LogFormat.
Additional Apache Log Related Modules
Following are additional log related modules available when additional details about the Apache server need to be captured.
Apache Forensic Logging with MOD_LOG_FORENSIC
This module provides the ability to log both the request and response entries separately in a log file. It can provide additional data that may be required for debugging an issue that cannot easily be resolved using standard log files.
Unlike other logging options, you cannot customize the format of the log entries. Enter the following line to your (virtual) host configuration to enable forensic logging.
ForensicLog logs/wp-forensic.logGoing to the home page of my test WordPress site, I find the following information in the forensic log file.
+18124:6369a48e:0|GET / HTTP/1.0|Host:wp.local|X-Real-IP:127.0.0.1|X-Forwarded-For:127.0.0.1|X-Forwarded-Proto:https|Connection:close|User-Agent:Mozilla/5.0 (Windows NT 10.0; Win64; x64; rv%3a106.0) Gecko/20100101 Firefox/106.0|Accept:text/html,application/xhtml+xml,application/xml;q=0.9,image/avif,image/webp,*/*;q=0.8|Accept-Language:en-US,en;q=0.5|Accept-Encoding:gzip, deflate, br|DNT:1|Cookie:wp-settings-time-1=1667359685; wordpress_test_cookie=WP%2520Cookie%2520check; wordpress_logged_in_299d5860428c7abcb8431877514b27a1=admin%257C1667525807%257CZJH5QwPuaOu2BoVUYtdy0rROwOiutpwGiHq75Vq0BFS%257Cf3847a4d2f4b28217c5625c10059e0dacdbec80b12371a60cacad3726585caee|Upgrade-Insecure-Requests:1|Sec-Fetch-Dest:document|Sec-Fetch-Mode:navigate|Sec-Fetch-Site:none|Sec-Fetch-User:?1

-18124:6369a48e:0

+18124:6369a490:1|GET /wp-includes/blocks/navigation/style.min.css?ver=6.1 HTTP/1.0|Host:wp.local|X-Real-IP:127.0.0.1|X-Forwarded-For:127.0.0.1|X-Forwarded-Proto:https|Connection:close|User-Agent:Mozilla/5.0 (Windows NT 10.0; Win64; x64; rv%3a106.0) Gecko/20100101 Firefox/106.0|Accept:text/css,*/*;q=0.1|Accept-Language:en-US,en;q=0.5|Accept-Encoding:gzip, deflate, br|DNT:1|Referer:https%3a//wp.local/|Cookie:wp-settings-time-1=1667359685; wordpress_test_cookie=WP%2520Cookie%2520check; wordpress_logged_in_299d5860428c7abcb8431877514b27a1=admin%257C1667525807%257CZJH5QwPuaOu2BoVUYtdy0rROwOiutpwGiHq75Vq0BFS%257Cf3847a4d2f4b28217c5625c10059e0dacdbec80b12371a60cacad3726585caee|Sec-Fetch-Dest:style|Sec-Fetch-Mode:no-cors|Sec-Fetch-Site:same-origin

-18124:6369a490:1Note: This is a lot of information to digest. Apache provides a check_forensic script to help analyze the data in this file.
If looking at this the important thing to note is that the number at start of each line, which in our case is 18124:6369a48e appears twice. Once with the + and the next time with a minus. This means that the + entry is for the request while the – entry is for the response. A missing – entry may suggest that although the request was received it was not successfully processed and the results did not get back to the client.
Security Note: HTTP headers are logged as part of the complete string. You never want to enable forensic logging except while debugging.
Capturing Data Transfer Information with MOD_LOGIO
Using this module for logging you can capture the number of bytes being received or sent per request. The numbers reflect the actual bytes as received on the network, which then takes into account the headers and bodies of requests and responses. The counting is done before SSL/TLS on input and after SSL/TLS on output, so the numbers will correctly reflect any changes made by encryption.
Using the following CustomLog format:
LogFormat "%h %l %u %t \"%r\" %>s %b %I %O" bytesdataI get the following entry in the log file.
127.0.0.1 - - [07/Nov/2022:16:52:25 -0800] "GET / HTTP/1.0" 200 51781 1327 53809MOD_LOGIO adds the following options to be used in LogFormat.
| Format | Description |
| %I | Bytes received, including request and headers. Non-zero value. |
| %O | Bytes sent, including headers. Non-zero value. |
| %S | Bytes transfered including headers. Non-zero value. |
| %^FB | Delay in microseconds between when request acceptance and first byte of the response headers are written. Only available if LogIOTrackTTFB is set to ON. |
How to View Apache Log Files
Apache web server log files are plain text files that can be viewed using any text editor. This strategy although great for debugging is not a great option when dealing with live sites. There are better tools available to help with that.
Sending log entries to SysLog is one option used in production environments for automated monitoring. In a later post I will be reviewing multiple free and open source tools to view and analyze Apache log files.
In the scope of this article let check out how you can view log files on a live server.
Viewing Apache Log Files in real-time with Shell Command
Using the tail command you can view the activity of a live server as requests are coming in.
root@s1 /var/log/apache2 # tail -f *.logThe -f option allows you to monitor multiple log files at the same time. This is helpful in a setup with multiple Virtual Hosts.
If you want to only monitor a single domain, you can use the command with the -f option and using the exact log file name.
root@s1 /var/log/apache2 # tail bm.logFiltering with Grep
At times you don’t want to see a display with flowing lines of text showing real-time activity. If you are focusing on a specific URL or HTTP command then you can use grep to filter data from the log file.
root@s1 /var/log/apache2 # grep 200 /var/log/apache2/bm.logIssues with Manual Search and Analysis of Log Files
The two methods I have shown above will work in development environments but will be challenging to say the least when used in a production environment with heavy traffic volumes. When the log files grow from kilo-bytes to mega-bytes and then to giga-bytes, the manual data analysis will no longer work.
Another issue comes up when you have multiple servers working in tandem, such as behind a load-balancer. Trying to combine data from multiple log files and then matching timestamps to track the path of a request through the flow pipeline is a futile exercise as requests go beyond a few dozen. [My post on setting up and using Vector for combined log collection and analysis coming soon].
You will need tools to help with that. There are many options available from free open source log analysis tools to big iron solutions from various commercial vendors. I will be reviewing both types of tools in a later post.
Conclusion
Analyzing your Apache servers logs is invaluable in understanding the traffic coming to your servers. Tracking errors, debugging applications and deciding when to scale up cannot be done effectively without analyzing server logs.
Logs provide you another way to track your website visitors, and their behavior as they go through various published resources. This invaluable information can be used to create better applications.
Security is another benefit gained by monitoring your logs actively.
Understanding Apache metrics and logs provide the ability to analyze them effectively is a requirement if you want to have an infrastructure that needs to be available 24/7.