Keeping an eye on your CPU’s temperature is more than just a good habit; it’s like giving your computer a health check and ensuring it runs at its best. When temperatures go haywire, it’s not just a glitch; it could lead to system crashes, data loss, or even permanent damage to your hardware.
See Also
If you are looking to prevent critical infrastructure from going down, having a reliable CPU temp monitor is a MUST.
A study found that the lifespan of a CPU can be significantly reduced if it operates at temperatures consistently above 80°C.
But with so many options out there, it can feel like navigating through a tech jungle. Don’t worry, though! This blog post will guide you through the top CPU temperature monitoring tools in 2024, considering different needs. It’s your go-to resource for finding the best fit without diving too deep into the tech jargon.
Get ready for a straightforward exploration of the coolest tools for monitoring CPU temperature!
What is Normal CPU Temperature?
The normal CPU temperature can vary based on factors such as the type of processor, the workload on the CPU, and the cooling solution in use. However, as a general guideline, here are typical temperature ranges for CPUs:
- Idle Temperature:
- For most CPUs, idle temperatures (when the system is not under heavy load) typically range between 30°C to 50°C (86°F to 122°F).
- Normal Operating Temperature:
- Under normal usage conditions, such as web browsing, document editing, or light multitasking, CPUs often operate in the range of 40°C to 70°C (104°F to 158°F).
- Gaming and Intensive Tasks:
- During gaming or other resource-intensive tasks, CPUs may experience higher temperatures. It’s common for gaming temperatures to range between 60°C to 80°C (140°F to 176°F) or slightly higher, depending on the specific CPU and cooling solution.
- Laptop CPUs:
- Laptops generally have different thermal characteristics than desktops. Laptop CPUs often have temperature ranges similar to desktop CPUs but may operate at slightly higher temperatures due to space constraints and different cooling mechanisms.
Note: The temperature ranges are provided are general guidelines. Always refer to the official documentation or specifications provided by the CPU manufacturer for accurate information on the recommended operating temperature range.
Factors That Can Raise CPU Temperatures
There are several reasons why your CPU temperature might rise, ranging from normal operation to potentially serious issues. Here are some common culprits:
Intensive Tasks:
- Heavy workload: Running resource-intensive applications, such as video editing software, 3D rendering, or complex simulations, can put a heavy load on the CPU, causing it to generate more heat. This can push your CPU to its limits, generating significant heat.
- Multiple programs running: Even without demanding tasks, running multiple programs simultaneously can put increased strain on the CPU, leading to temperature spikes.
- Background processes: Certain background processes like antivirus scans or automatic updates can also put temporary strain on the CPU and raise its temperature.
Hardware Issues:
- Faulty fan: A malfunctioning or clogged fan can significantly impact your CPU’s cooling ability, resulting in overheating.
- Insufficient or Dried-out thermal paste: Thermal paste transfers heat from the CPU to the heatsink. Over time, it can dry out and lose its effectiveness, leading to higher temperatures.
- Insufficient airflow: Poor case ventilation or dust buildup can restrict airflow within your PC, preventing effective heat dissipation from the CPU.
- Overclocking: Overclocking, or running the CPU at a higher clock speed than its default settings, increases the workload and generates more heat. Without proper cooling, this can lead to temperature spikes..
High temperatures can lead to system crashes and instability: If the CPU gets too hot, it can shut down the system to prevent damage. This can be frustrating and cause data loss.
Software Issues:
- Malware: Some malware can utilize your CPU for its own purposes, like mining cryptocurrency, leading to increased temperatures.
- Outdated drivers: Outdated CPU drivers can sometimes lead to inefficient power management or performance issues, potentially increasing CPU temperature.
- BIOS settings: Improper BIOS settings for fan curves or CPU voltage could hinder your cooling capabilities and contribute to overheating.
- Background Processes and Poorly Written Applications: Unnecessary background processes or programs can consume CPU resources, resulting in higher temperatures. Closing unused applications can alleviate this issue.
Environmental Factors:
- Ambient temperature: The external temperature in the environment where the computer is located can influence CPU temperature. High room temperatures can make it more challenging for the cooling system to keep the CPU cool.
- Direct sunlight: Exposing your PC to direct sunlight can significantly increase its internal temperature.
- Dust accumulation on components can also impede heat dissipation.
CPU Temp Monitoring Tools Feature Comparison Table
| Core Temp | Glances | Gnome System Monitor | HWiNFO | HWMonitor | lm-sensors | MSI Afterburner | NZXT CAM | |
|---|---|---|---|---|---|---|---|---|
| Price | Free | Free | Free | Free (Pro version available) | Free | Free | Free | Free |
| Supported OS | Windows | Linux, macOS, Windows | Linux | Windows | Windows | Linux | Windows | Windows |
| Interface | Graphical | Text-based | Graphical | Graphical | Graphical | Command-line | Graphical | Graphical |
| CPU temperature monitoring | Yes | Yes | Yes | Yes | Yes | Yes | Yes | Yes |
| Benchmarking capabilities | No | No | No | No | No | No | No | No |
| Customizable interface | Limited | Yes | Limited | Yes | Yes | Yes | Limited | Yes |
| Customizable reports | No | No | No | No | No | No | No | No |
| Fan control | No | No | No | No | No | No | Limited | Yes |
| Fan speed monitoring | No | Yes | Yes | Yes | Yes | Yes | Yes | Yes |
| GPU temperature monitoring | No | No | No | Yes | Yes | No | Yes | Yes |
| Integrated with desktop environment | No | No | Yes | No | No | No | No | No |
| Overclocking support | No | No | No | Yes | No | No | Yes | No |
| On-screen overlay | No | No | No | No | No | No | Yes | Yes |
| On-screen widgets | No | No | No | No | Yes | No | Yes | No |
| Performance tracking | No | Yes | No | Yes | No | No | Yes | Yes |
| Recording capabilities | No | No | No | No | No | No | Yes | No |
| Remote monitoring | No | Yes | No | No | No | No | No | No |
| Voltage monitoring | Yes | Yes | No | Yes | Yes | Yes | Yes | Yes |
Benchmarks often showcase significant performance gains when keeping CPU temperatures lower, especially for overclocked systems.
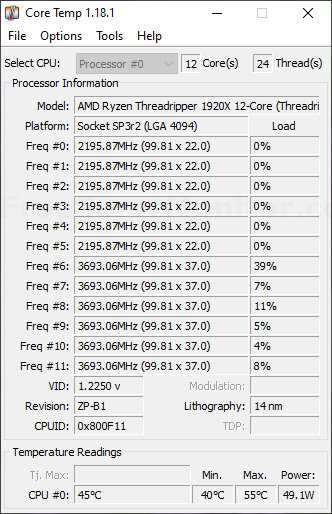
CoreTemp
Core Temp is a monitoring utility with a small footprint that provides real-time insights into the thermal performance of your processor. With support for a wide range of CPUs from various manufacturers, Core Temp displays the temperature of each individual core, allowing users to track and analyze heat levels accurately.
The user-friendly interface presents essential information, such as current temperature, maximum temperature reached, and load percentages. Core Temp also features customizable alerts, ensuring users are promptly notified if temperatures exceed predefined thresholds.
Real-Time Temperature Monitoring
Support for a Wide Range of CPUs
Detailed Core Information
Customizable Temperature Alerts
User Friendly Interface
Features
- Real-Time Temperature Monitoring:
- Core Temp provides users with up-to-the-moment data on the temperature of each individual CPU core, offering a comprehensive overview of thermal performance. This real-time monitoring is crucial for users to assess and respond to any potential overheating issues promptly.
- Support for a Wide Range of CPUs:
- Core Temp is designed to be compatible with an extensive array of CPUs from different manufacturers. This versatility ensures that users with diverse computer configurations can benefit from accurate temperature readings and monitoring capabilities, irrespective of the processor brand.
- Detailed Core Information:
- The utility offers in-depth information about each core, including the current temperature, maximum temperature reached, and the load percentage on each core. This detailed data empowers users to understand how their CPU is performing under various workloads.
- Customizable Temperature Alerts:
- Core Temp allows users to set customizable temperature alerts, providing a proactive approach to system maintenance. If temperatures surpass user-defined thresholds, the utility triggers alerts, allowing users to take preventive measures and avoid potential overheating-related issues.
How to Install CoreTemp
- Download Installer: Got to URL https://www.alcpu.com/CoreTemp/., to download the latest core-temp installer.
- Run CoreTemp: You can run the program at the end of the install or later by clicking on the CoreTemp shortcut.
GLANCES
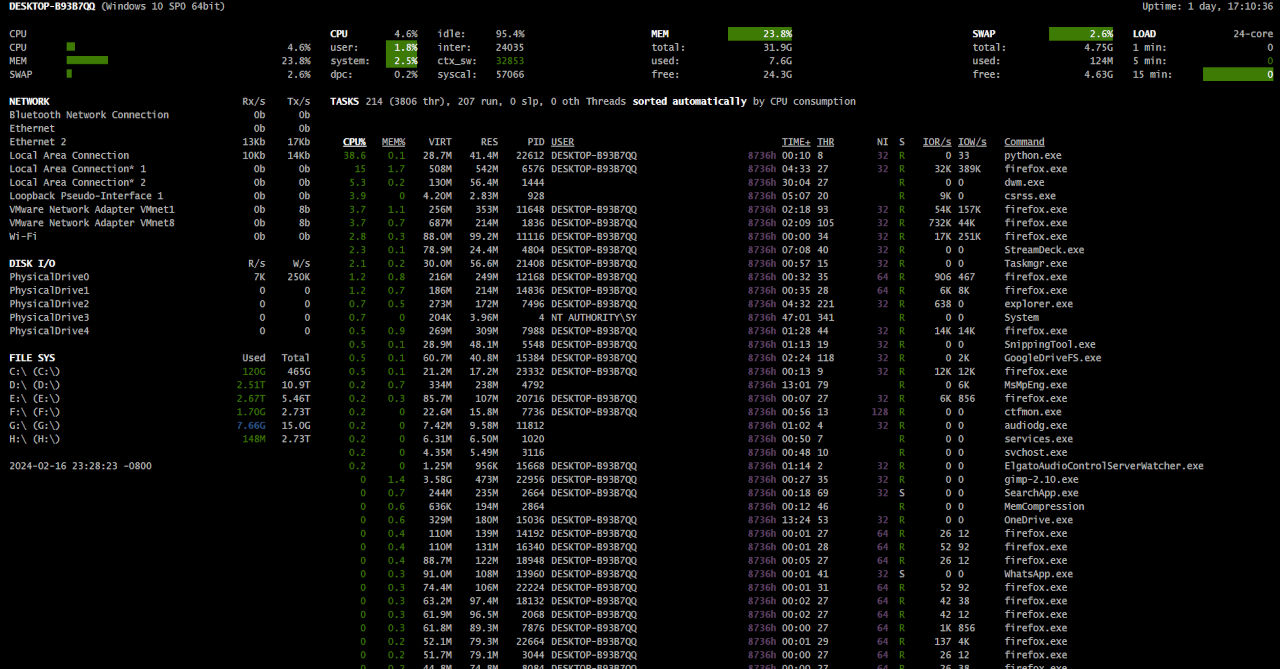
Glances is a versatile CPU temperature monitoring utility with a user-friendly interface and cross-platform compatibility. It provides real-time information on CPU temperatures and offers a comprehensive view of various system metrics, including memory usage and disk activity. The utility is suitable for users with diverse technical expertise and features customizable alerts for proactive temperature management on different operating systems.
Customizable alerts and notifications
Comprehensive system metrics
Multi-platform
Real-time monitoring
User friendly interface
Features
- Customizable Alerts and Notifications: Glances features customizable alerts and notifications, allowing users to set thresholds for CPU temperature. When these thresholds are exceeded, users receive timely alerts, empowering them to take proactive measures to prevent potential overheating issues.
- Comprehensive System Metrics: In addition to CPU temperature, Glances provides a holistic view of various system metrics, including memory usage, disk activity, and network performance, consolidating crucial information in one centralized interface.
- Multi-Platform Compatibility: Glances supports multiple operating systems, including Linux, Windows, and macOS, providing a universal solution for users with diverse system configurations.
- Real-Time Monitoring: The utility offers real-time monitoring of CPU temperatures, enabling users to promptly identify and address any abnormal temperature spikes or fluctuations.
- User-Friendly Interface: Glances ensures accessibility for users of all technical levels. The straightforward design makes it easy for both casual users and system administrators to navigate and interpret the data.
How to Install Glances on Windows
- Install Python
- Install Curses:
pip install windows-curses - Install Glances:
pip install glances - Run Glances by typing
glancesin Windows command line and pressing enter. - Optional: To run glances in web mode run the utility by entering glances -w in a command line window. You can access the web interface by going to the UR
http://127.0.0.1:61208/. [To run in web mode you need additional Python package. Install it by typingpip install bottleat the command prompt.
Gnome System Monitor
The GNOME System Monitor CPU Temperature Utility, a key component of the GNOME desktop environment, facilitates seamless monitoring of CPU thermal performance. Its intuitive graphical interface provides real-time temperature updates, ensuring effortless CPU health monitoring. Prioritizing simplicity, the GNOME System Monitor caters to users of all technical levels, offering easy access to critical CPU temperature information and enhancing overall system stability.
Customizable alerts
Graphical user iinterface
Individual core monitoring
Integration with GNOME desktop
Resource usage overview
Features
- Customizable Alerts: The utility allows users to set customizable alerts for CPU temperatures, ensuring timely notifications if temperatures exceed predefined thresholds.
- Graphical User Interface: The utility boasts a user-friendly graphical interface, making it accessible and visually intuitive for users to monitor CPU temperatures in real-time.
- Individual Core Monitoring: Users can track the temperature of each individual CPU core, gaining detailed insights into the thermal performance of their processor.
- Integration with GNOME Desktop: As an integral part of the GNOME desktop environment, this monitoring utility seamlessly integrates with the overall system, providing a cohesive user experience for GNOME users.
- Resource Usage Overview: GNOME System Monitor provides an overview of system resource usage, including cpu, memory, disk, and network statistics.
How to Install GNOME System Monitor on Ubuntu?
You can install GNOME system monitor on Ubuntu using snapd package manager. Use the following commands for installation.
sudo apt update
sudo apt install snapd

sudo snap install gnome-system-monitor
HWiNFO
HWINFO is a powerhouse CPU temperature monitoring utility that delves deep into your system, providing comprehensive information on your CPU, GPU, motherboard, and other components. It goes beyond simple temperature readings, offering detailed sensor data, voltage monitoring, fan control options, and even overclocking support for tech enthusiasts.
In-depth hardware info
Customizable dashboard
Extensive reporting and logging
Real-time system monitoring
Secure: Does not collect personal info
Features
- Alerting and logging: Set up alerts for critical values and log historical data for trend analysis and proactive maintenance.
- Customizable dashboard: Create personalized dashboards with the information you need most, displayed in your preferred format and layout.
- Detailed reporting: Generate comprehensive reports on your system configuration and performance, ideal for troubleshooting or sharing with technical support.
- Extensive system monitoring: HWINFO gathers data from a vast array of sensors, offering detailed insights into your system’s health and performance.
- Hardware tweaking: Adjust fan speeds, manage voltages, and even explore overclocking options for experienced users.
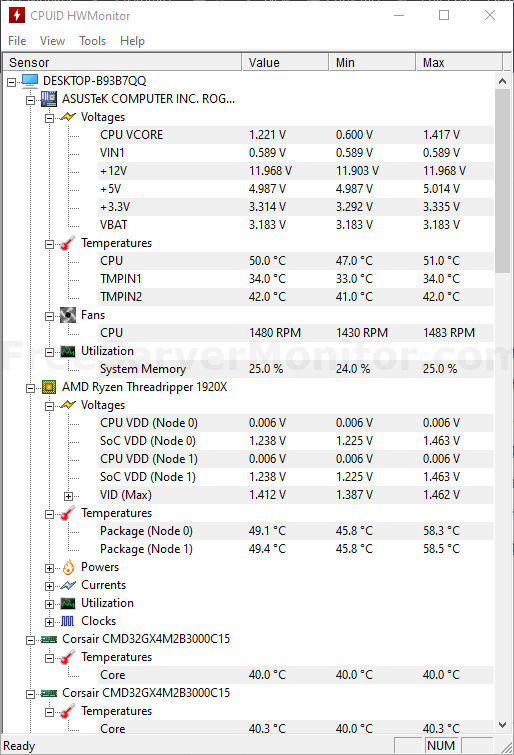
HWMonitor
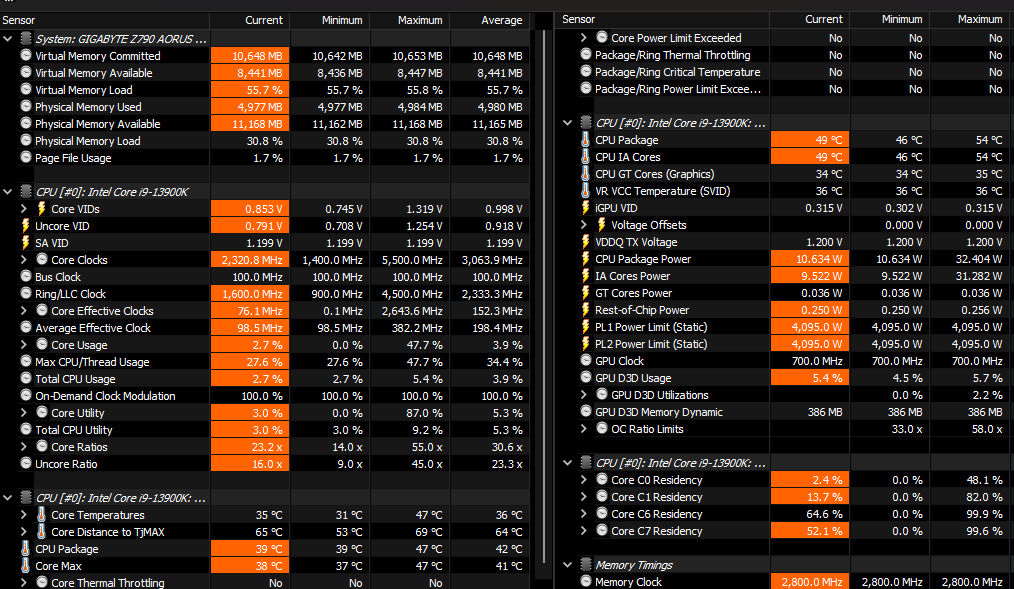
HWMonitor is a user-friendly, no-nonsense CPU temperature monitoring utility that keeps you informed without overwhelming you.
It displays essential information like CPU temperatures, voltages, and fan speeds in a straightforward interface, letting you quickly gauge your system’s health at a glance. But don’t underestimate its potential!
CPU and GPU Monitoring
Memory modules with thermal sensors
SSD/Hard Disk monitoring via S.M.A.R.T
LPCIO chips with monitoring features
Portable
Customizable monitoring
Features
- Alerting and logging: Set up alerts for temperature spikes or other critical values, and track historical data for further analysis.
- Customizable monitoring: Choose which sensors you want to display and arrange them in a way that suits your needs.
- Portable: HWMonitor is completely free and doesn’t require installation, making it easy to run on any system.
- Multiple sensor support: HWMonitor tracks temperatures not just for your CPU, but also for GPUs, hard drives, and other components.
- Simple and lightweight: HWMonitor runs unobtrusively in the background, consuming minimal resources while keeping an eye on your CPU’s vitals.
CONS
- Available only on windows platform.
- Advanced features available only on the PRO version.
How to Install CPUID HWMonitor
- Download: Go to URL https://www.cpuid.com/softwares/hwmonitor.html and download either the Install or the ZIP file.
- Run: Clicking on the correct version of the program . I am using the 64 bit version
HWMonitor_x64.exeand most will likely use the same.
lm-sensors
For power users, lm-sensors is a command-line powerhouse that provides more info than just CPU temperature monitoring. It delves deep into your hardware, automatically discovering sensors and providing raw data, current readings, and historical graphs.
While its interface might seem less polished than graphical tools, it offers unmatched flexibility and precision.
Broad sensor compatibility
Command-line interface
Detailed sensor information
Dynamic sensor configuration
Open source flexibility
Features
- Broad Sensor Compatibility: lm-sensors supports a wide range of sensors and motherboards, ensuring compatibility with diverse Linux-based systems and hardware configurations.
- Command-Line Interface: lm-sensors employs a command-line interface, offering a direct and efficient way for users to access and interpret sensor data without the need for a graphical user interface.
- Detailed Sensor Information: The utility provides detailed sensor information, including CPU temperature, fan speeds, and voltage levels, giving users a comprehensive overview of their system’s hardware metrics.
- Dynamic Sensor Configuration: lm-sensors enables users to dynamically configure and calibrate sensors, allowing for fine-tuning and customization based on individual preferences and hardware requirements.
- Open-Source Flexibility: Being an open-source utility, lm-sensors allows users to tailor and modify the tool to meet their specific needs, contributing to its adaptability in the Linux ecosystem.
Hot to Install LM-Sensors
- Install:
sudo apt-get install lm-sensors - Configure:
sudo sensors-detect(You may need to run the following as well –sudo service kmod start) - Run:
$ sensors
coretemp-isa-0000
Adapter: ISA adapter
Core 0:      +41.0°C  (high = +78.0°C, crit = +100.0°C)

coretemp-isa-0001
Adapter: ISA adapter
Core 1:      +41.0°C  (high = +78.0°C, crit = +100.0°C)

w83627dhg-isa-0290
Adapter: ISA adapter
Vcore:       +1.10 V  (min =  +0.00 V, max =  +1.74 V)
in1:         +1.60 V  (min =  +1.68 V, max =  +1.44 V)   ALARM
AVCC:        +3.30 V  (min =  +2.98 V, max =  +3.63 V)
VCC:         +3.28 V  (min =  +2.98 V, max =  +3.63 V)
in4:         +1.85 V  (min =  +1.66 V, max =  +1.11 V)   ALARM
in5:         +1.26 V  (min =  +1.72 V, max =  +0.43 V)   ALARM
in6:         +0.09 V  (min =  +1.75 V, max =  +0.62 V)   ALARM
3VSB:        +3.30 V  (min =  +2.98 V, max =  +3.63 V)
Vbat:        +3.18 V  (min =  +2.70 V, max =  +3.30 V)
fan1:          0 RPM  (min = 10546 RPM, div = 128)  ALARM
fan2:        892 RPM  (min = 2136 RPM, div = 8)  ALARM
fan3:          0 RPM  (min = 10546 RPM, div = 128)  ALARM
fan4:          0 RPM  (min = 10546 RPM, div = 128)  ALARM
fan5:          0 RPM  (min = 10546 RPM, div = 128)  ALARM
temp1:       +36.0°C  (high = +63.0°C, hyst = +55.0°C)  sensor = diode
temp2:       +39.5°C  (high = +80.0°C, hyst = +75.0°C)  sensor = diode
temp3:      +119.0°C  (high = +80.0°C, hyst = +75.0°C)  ALARM  sensor = thermistor
cpu0_vid:   +2.050 V
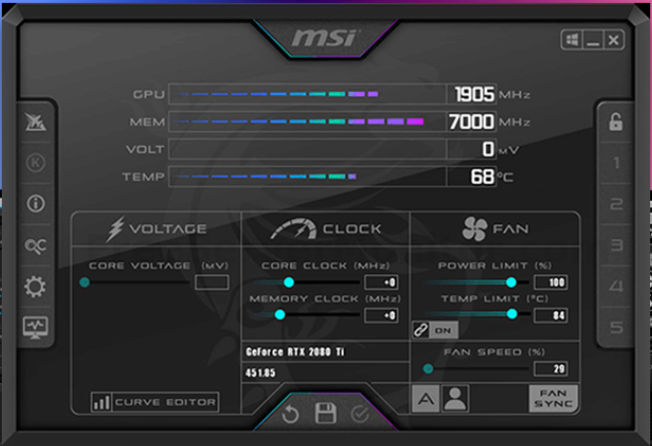
MSI Afterburner
MSI Afterburner, renowned for its prowess in GPU overclocking, extends its capabilities to CPU temperature monitoring, offering users a comprehensive solution for system performance management.
This utility, developed by MSI, allows users to not only tweak GPU settings but also keep a close eye on crucial hardware metrics, including CPU temperature.
The best part about AfterBurner is that it even supports system not using MSI hardware.
Customizable profiles
Overclocking and monitoring
Hardware information overlay
Real-time monitoring
Easy to use GUI
Compatible with MSI and other hardware
Features
- Customizable Fan Profiles: Users can create custom fan profiles to regulate system cooling based on their preferences and performance requirements, contributing to effective temperature management.
- GPU Overclocking and Monitoring: MSI Afterburner is widely recognized for its GPU overclocking capabilities, making it a versatile tool for optimizing both GPU and CPU performance.
- Hardware Information Overlay: Afterburner includes a hardware information overlay, displaying essential metrics such as CPU temperature, GPU temperature, and usage percentages directly on the screen during gaming or other full-screen applications, enhancing real-time monitoring.
- Real-Time CPU Temperature Monitoring: Afterburner provides real-time updates on CPU temperature, allowing users to track and manage thermal performance alongside GPU tuning.
- User-Friendly Interface: The utility features an intuitive and user-friendly interface that simplifies the process of monitoring and adjusting hardware settings, catering to users of varying technical expertise.
How to Install MSI Afterburner
- Download: Get the latest version from URL.
- Install: Just run the downloaded executable to install the program.
NZXT CAM
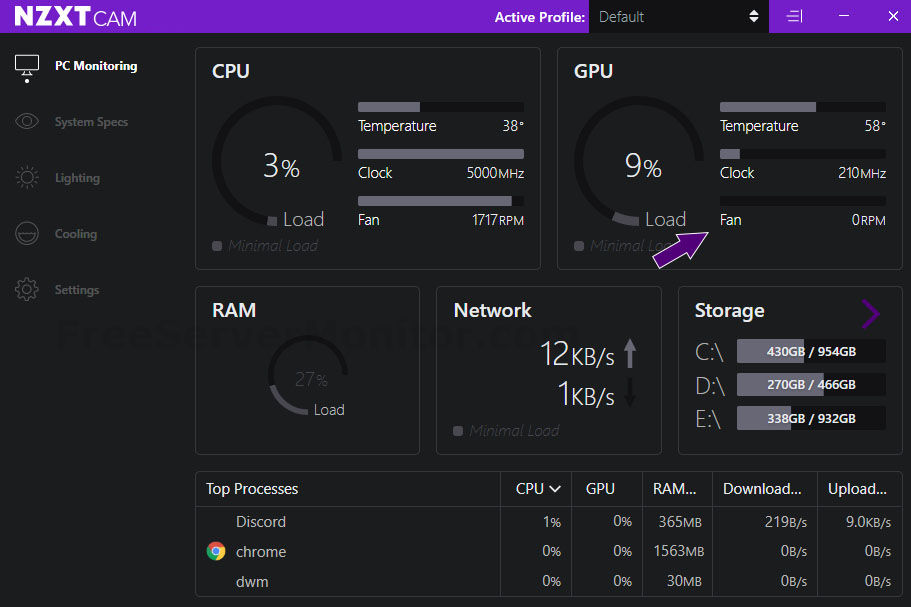
NZXT CAM isn’t just about CPU temperature monitoring; it’s a one-stop shop for power users wanting to control their system’s aesthetics and performance.
Alongside real-time CPU and GPU temp displays, CAM boasts vibrant RGB lighting customization, fan control for whisper-quiet gaming, and even performance tracking for data-driven optimization.
All in one monitoring
Compatible with NZXT and other hardware
Historical data logging
Smart scheduling
Performance tracking and optimization
Customizable dashboard
Features
- All-in-one monitoring and control: Track CPU and GPU temperatures, adjust fan speeds, and customize RGB lighting, all from a single, user-friendly interface.
- Free and compatible: Works seamlessly with NZXT hardware and a wide range of other components, making it a versatile choice for most gaming PCs.
- Historical data logging: CAM includes a detailed historical data log, allowing users to review past CPU temperature trends and identify patterns for effective long-term system optimization..
- Performance tracking and optimization: Analyze resource usage, CPU/GPU clock speeds, and frame rates to identify bottlenecks and optimize settings for smoother gameplay.
- Sleek, customizable dashboard: Design your monitoring layout with widgets, graphs, and alerts to keep an eye on what matters most to you.
How to Install NZXT CAM
- Install: Download from https://nzxt-app.nzxt.com/NZXT-CAM-Setup.exe and run the
EXEto install.
What are best practices for monitoring cpu temp?
Monitoring your CPU temperature is crucial for maintaining a healthy and performing computer. Here are some best practices for effective CPU temperature monitoring:
Consider your needs:
- Simple monitoring: Open Hardware Monitor, Psensor
- Customization and alerts: HWMonitor, Core Temp, Rainmeter
- Fan control and advanced features: SpeedFan, lm-sensors (Linux)
Monitor Key Metrics:
- CPU temperature: Watch for sustained temperatures above recommended levels (typically 60-80°C under load).
- Fan speeds: Ensure fans are spinning and adjust speeds if necessary.
- Voltages (optional): Can indicate potential hardware issues.
Choose the Right Tool:
- Windows: Open Hardware Monitor, HWMonitor, Core Temp, SpeedFan, Rainmeter
- macOS: iStat Menus, HWMonitor
- Linux: lm-sensors, Psensor, Gnome System Monitor
Set Up Alerts:
- Temperature spikes: Warn you of potential overheating risks.
- Fan failure: Alert you to replace or fix malfunctioning fans.
How to read CPU temperature without using third party apps?
If you want to find out the temperature without installing anything add on software on Linux or Ubuntu, then use:
$ cat /sys/class/thermal/thermal_zone*/temp
20000
53000
50000
53000
56000
68000
49000
50000
To see what zones the temperatures are referring to:
$ paste <(cat /sys/class/thermal/thermal_zone*/type) <(cat /sys/class/thermal/thermal_zone*/temp) | column -s $'\t' -t | sed 's/\(.\)..$/.\1°C/'
INT3400 Thermal  20.0°C
SEN1             45.0°C
SEN2             51.0°C
SEN3             57.0°C
SEN4             59.0°C
pch_skylake      77.5°C
B0D4             50.0°C
x86_pkg_temp 51.0°CNote: The temperatures are stored in Celsius.
Conclusion
From minimalist monitors to customizable dashboards, there’s a CPU temperature tool for every user. If you are looking for a simple yet powerful tool lm-sensors on Linux and Ubuntu is your go to option.
On Windows NXXT CAM and MSI Afterburner offer the most features while being free.
Increased temperature can throttle CPU performance: As the CPU heats up, it automatically reduces its clock speed to prevent damage. This can lead to noticeable slowdowns and lagging, especially in demanding tasks like gaming or video editing.
Whichever tool you end up selecting, make sure that you follow the following:
General Practices:
- Maintain good airflow: Keep your PC in a well-ventilated area and clean dust buildup.
- Optimize software: Close unnecessary programs and adjust power settings.
- Update drivers and BIOS: Ensure you have the latest firmware for optimal performance and temperature control.
- Stress test (optional): Run stress tests to identify under-performance or thermal issues.
Additional Tips:
- Log historical data: Analyze temperature trends over time to identify potential problems.
- Monitor other components: GPU, hard drives, and motherboards can also overheat.
- Don’t panic: Occasional temperature spikes are normal, but sustained high temperatures require action.